Research & Development Center
Research & Development Unit
YANMAR Technical Review
Establishment of Heat Treatment Analysis Technique~Improvement in Analysis Accuracy of Phase Transformation During Induction Hardening~
1. Introduction
As internal combustion engines have been made lighter in recent years with higher outputs, there is a trend toward higher loads being imposed on engine components. In particular, on crankshafts, the associated torsional loads due to high power transmission, the rapid pressure changes inside cylinders during combustion, and the sliding motion of parts like connecting rods or bearings mean that maintaining fatigue strength, toughness, and wear resistance are important considerations. Induction hardening is a widely used heat treatment technique that can satisfy these multiple objectives. These excellent properties are achieved through rapid changes in structure distribution resulting from localized treatment, and through the large residual stresses in structural material resulting from the structure distribution changes. However, because it is currently difficult to quantitatively evaluate residual stresses, there may be cases of negative effect on the durability of products due to the presence of residual stresses in unintended locations. In the future, the quantitative evaluation of residual stresses and structure distribution resulting from heat treatment will become increasingly important, with a need for more advanced product design techniques to cope with higher engine outputs and lighter weights.
Because heat treatment is a very complex process involving interaction between changes in phase, temperature, and strain, it is generally difficult to predict residual stresses and structure distributions. Consequently, the heat treatment conditions for hardening are frequently determined based on past experience or through trial and error. To overcome this problem, considerable researches concerning heat treatment analysis for determining ideal treatment conditions have been studied since around 1980. In one example, Inoue et al. predicted the martensite phase fraction, residual stress, and deformation of four different type steels during quenching process using Jominy test pieces, and compared the predictions with experimental results to verify their accuracy(1). Wang et al. predicted phase transformations considering the dependence of phase transformation on stress(2). Smoljan et al. predicted the strength and hardness after the quenching(3). Takagaki et al. and Ikuta et al. performed phase transformation analysis on induction hardening to predict martensite transformation and residual stress(4)(5). However, these analyses only categorized the phase transformations during hardening into diffusional and diffusionless transformations, treating the ferrite phase, pearlite phase, bainite phase as all belonging to the diffusional transformation category despite their being individual phenomena. This indicates that the formation of each phase has not been adequately considered, which is likely to present a subject for the accurate prediction of residual stress.
In this regard, some research has already been done into differentiating the bainite transformation (an intermediate transformation) from diffusional transformations. In one example, Bhadeshia conducted isothermal transformation experiments to confirm that the nucleation rate during bainite transformation is increased by the cementite that forms at the same time as the bainite phase. He also proposed this as a mechanism for autocatalytic nucleation and verified the accuracy at the development equation level(6). Also, Opdenacker performed a phase transformation analysis of a number of different steels that took account of this autocatalytic nucleation(7). Because grain size has a major influence on phase transformation, similar to steel grade, as reported by Kirkaldy et al.(8), the above research is insufficient for predicting the progress of phase transformations in actual materials because it does not consider grain size.
Accordingly, this work predicts the phase fraction for each of the ferrite, pearlite, bainite, and martensite phases. To improve the accuracy of phase fraction prediction, it also uses a development equation that considers the autocatalytic nucleation mechanism proposed by Opdenacker to predict the progress of the bainite transformation. While Bhadeshia uses the time-temperature-transformation (TTT) diagram as the basis for identifying the material constant to use for the autocatalytic nucleation mechanism, this work considered a simple method for identifying the properties from the phase fraction data in the continuous cooling transformation (CCT) diagram. The research also included an analysis of the phase transformations that take place during induction hardening of crankshafts for internal combustion engines to verify the validity of the method by comparing it with the results of test.
2. Formulation of Equations
Heating steel causes an austenite phase transformation to occur. When steel is then cooled from an austenitic state, the following three type transformations occur depending on the cooling rate.
- A diffusionless transformation involving the formation of martensite phase
- A diffusional transformation involving the formation of ferrite and pearlite phases
- An intermediate transformation involving the formation of bainite phase
Past research into predicting the process of phase transformations often did not differentiate between diffusional and intermediate transformations, instead adopting the simplification of treating the ferrite, pearlite, and bainite phases as all being the same phase. In contrast, this work described here considers all four phases individually (the above three phases and the martensite phase formed by diffusionless transformation). The accuracy of phase transformation prediction has also been improved by using a development equation for the intermediate transformation introducing autocatalytic nucleation coefficient.
This work uses the JMAG software from JSOL Corporation for the analysis of induction heating. The analyses of phase transformations during induction heating and cooling were performed implementing the equations described in sections 2.2 to 2.5, to the User Subroutine function of ABAQUS from Dassault Systèmes.
The following sections describe the constitutive equation used for induction heating and the development equations used for analysis of phase transformations.
2.1. Constitutive Equation for Induction Heating
The heat conduction phenomenon during induction heating was analyzed by coupling Maxwell’s equations and the heat conduction equation. Equation (1) is the fundamental equation for the electromagnetic field generated by a sinusoidal electric current. Here, is the permeability,
 is the vector potential,
 is the imaginary unit,
 is the angular velocity of current,
 is the electrical conductivity, and
 is the induced current density.

The Joule loss due to induction heating is calculated from equation (2), and the temperature change is calculated from equation (3) using this
 as the heat source. Here,
 is the specific heat,
 is temperature,
 is the thermal conductivity, and
 is the density.


2.2. Development Equation for Predicting Diffusionless Transformation
It is known that diffusionless transformation commences when the material is cooled below the martensite start temperature and progresses only depending on temperature. The Koistinen-Marbuerger equation (4) is used to predict this progress(9). Here,
 is the martensite volume fraction and
 is the austenite volume fraction at the time when the temperature reaches the martensite start temperature. The work described here was conducted on non-thermal refining S50C steel, which is widely used in heat treatment. Table 1 lists the material properties and chemical composition of the steel used. Here,
 ,
, and
and are the martensite start temperature,
 temperature, and
 temperature, which are calculated from the chemical composition using Kunitake’s equation(10).

Table1 Transformation temperature and chemical composition

2.3. Development Equation for Predicting Diffusional Transformations
Diffusional transformations are associated with the diffusion of carbon or other elements, with a start timing that depends on the histories of temperature and time. Scheil’s additive rule given in equation (5) is used to determine when transformation will start(11). Here, is the time increment for step
 in time steps
 and
and is the latent time until the diffusional transformation starts. Transformation is judged to start when the contributions of each step
 sum up to 1. Note that
 is determined from the TTT diagram in Fig. 1.

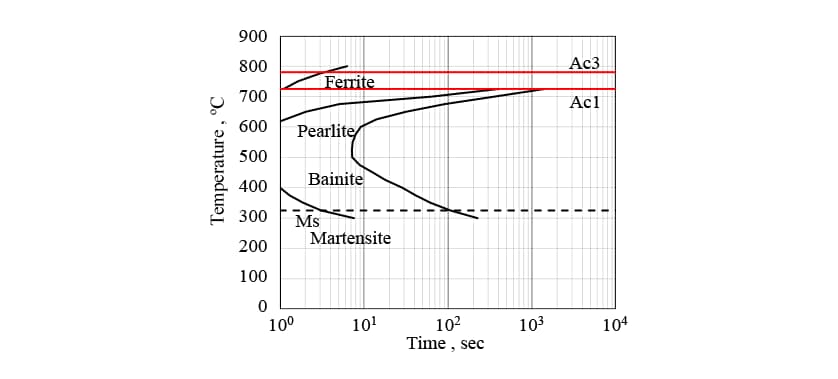
The Kolmogrov-Johnson & Mehl-Avrami (KJMA) equation (6) is used to predict the progress of diffusional transformation(12). The and
and terms in equation (6) are the material constants calculated using equations (7) and (8) from the initial transformation volume fraction
 , the end fraction
 , and the transformation start and end times obtained from the TTT diagram (
 and
and ).
).


2.4. Development Equation for Predicting Intermediate Transformations
As with diffusional transformation, the start of intermediate transformation is predicted by substituting the bainite transformation start and end times from the TTT diagram in Scheil’s additive rule in equation (5). Bhadeshia has reported that the nucleation rate for the bainite transformation is increased by the effect of the cementite that precipitates at the same time as the bainite phase forms. Accordingly the progress of the intermediate transformation is predicted using equation (9), which is based on the KJMA equation (6) with the addition of a term representing autocatalytic nucleation. Here, is the volume fraction of bainite at the
 th step and
 is the autocatalytic nucleation coefficient.
 is a material constant that depends on the carbon concentration. Past research using steels with a similar carbon concentration have reported values of
 (7).
(7).
Because induction heating acts quickly, only a part of the material transforms into austenite phase. The S50C steel consists of a mixture of ferrite phase containing very little carbon and pearlite phase with a high carbon concentration. During heating, the austenite transformation occurs preferentially in the pearlite phase, thereby increasing the carbon concentration in this region. Because tends to decrease with increasing carbon concentration, the influence of carbon concentration in S50C steel is considered by equation (10). Here,
 is the autocatalytic nucleation coefficient for the case when all of the material has transformed to austenite and the carbon has diffused uniformly.


2.5. Development Equation for Predicting Austenite Transformation During Induction Heating
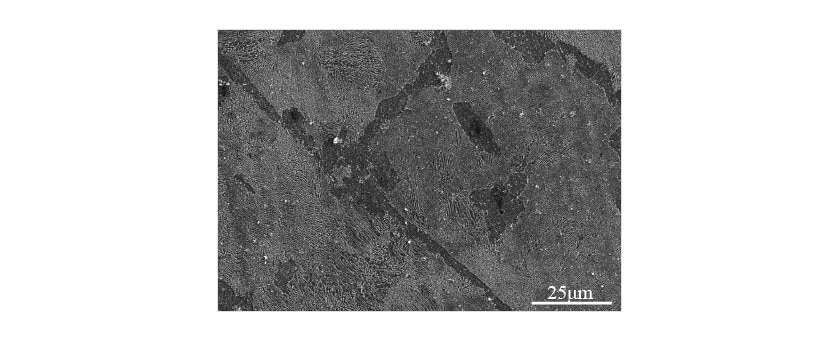
As the temperature rises during induction heating, austenite transformation from the initial structure (which includes ferrite and pearlite phases) occurs. The austenite transformation typically has a latent period and then starts around grain boundaries. Fig. 2 shows a metallographic photograph of the non-quenched S50C steel used in this research. The non-quenched S50C steel has a large grain size of around 100 μm and a comparatively long latent period. Using the time-temperature-austenization (TTA) diagram in Fig. 3(13), the start of transformation is predicted using equation (5) and the progress is predicted using equation (6), as for the diffusional transformation case.

2.6. Verification of Phase Transformation Prediction Accuracy and Identification of Autocatalytic Nucleation Coefficient
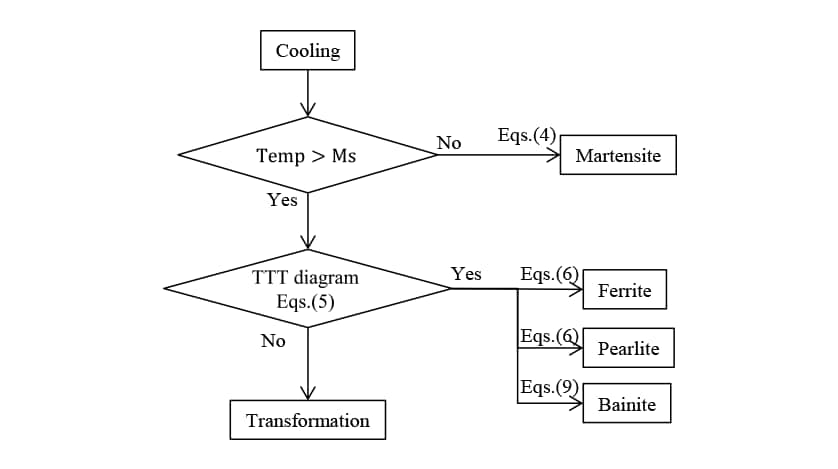
The accuracy of the phase transformation analysis introducing an autocatalytic nucleation coefficient was verified for S50C steel. Fig. 4 shows a flowchart of the phase transformations analysis during the induction hardening used in this work.
In Fig. 5, the measured CCT diagram for S50C steel is shown by the solid lines and the results of transformation start timing prediction obtained by the analysis are shown as dashed lines. While the transformation start timings for the ferrite, pearlite, and bainite phases are slightly different, the results indicate that the predictions are sufficiently accurate for practical purposes. Fig. 6 shows the phase fractions for each of the cooling conditions indicated by the dot-dash lines in Fig. 5, which range from fast (a) to slow (c) cooling. Here, in addition to the measured phase fractions, indicates the phase fractions predicted by the analysis without considering autocatalytic nucleation, and
 indicates the predictions when autocatalytic nucleation is considered. For cooling conditions b, under which the measured martensite phase fraction is 40%, the
 prediction is significantly larger at 59% compared to 35% for the case when autocatalytic nucleation is considered. Considering autocatalytic nucleation also improves the prediction accuracy for the other cooling conditions.
In this way, phase transformation prediction accuracy has been improved by using an equation that takes account of autocatalytic nucleation during intermediate transformations, and using an autocatalytic nucleation coefficient obtained by an experimental approach. Based on these results, the value of the autocatalytic nucleation coefficient for the case considered here has been found to be


3. Application for the Induction Hardening Test
3.1. Test Conditions
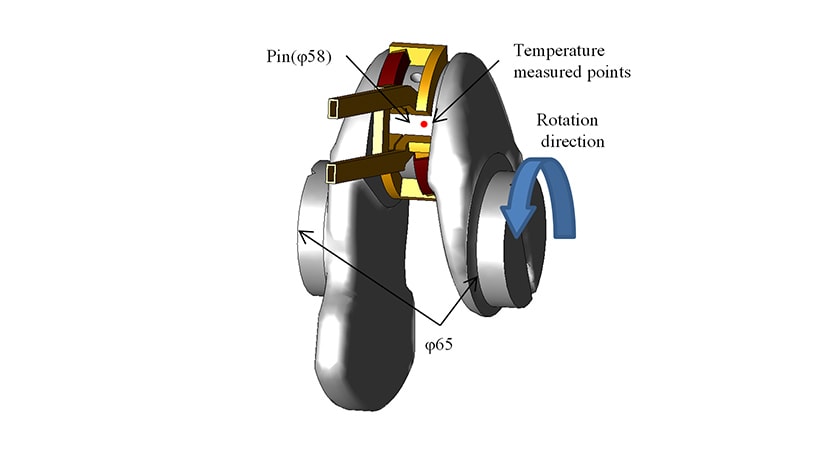
This work used the crankshaft for an internal combustion engine made from non-thermal refining S50C steel shown in Fig. 7. The induction hardening was performed using an induction hardening equipment made by Denki Kogyo Co., Ltd. by rotating the crankshaft at 30 min-1 in a semicircular copper coil and heating it using frequency of 20 kHz and current of 6000 A. After heating for the specified time, the crankshaft was hardened by quenching in water. The temperature changes during heating and hardening were measured by inserting type K sheathed thermocouples to the temperature measured points shown in Fig. 7 (at positions 1mm, 3mm, and 5mm from the crankshaft surface). After hardening, the crankshaft was sectioned and the structure distribution of the cross section observed.
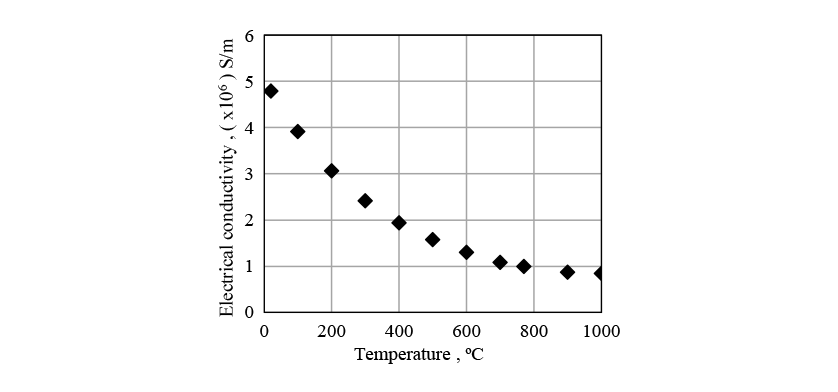
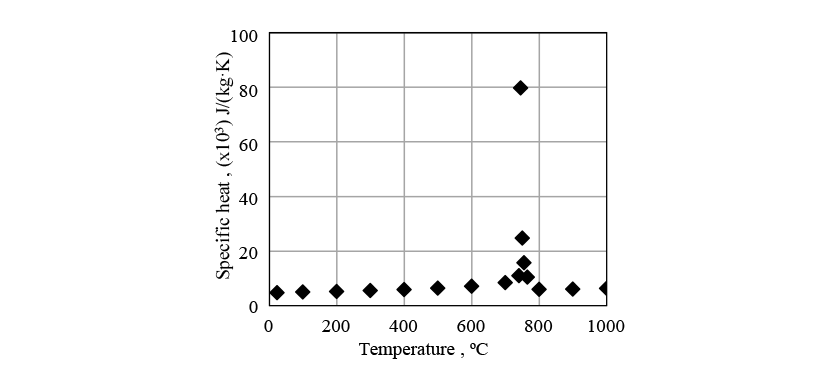
Figs. 8 to 10 show the physical properties used in the induction heating analysis. The specific heat is the apparent specific heat that includes latent heat. The heat transfer coefficient between the crankshaft surface and surrounding atmosphere was given as a boundary condition.

3.2. Test Results
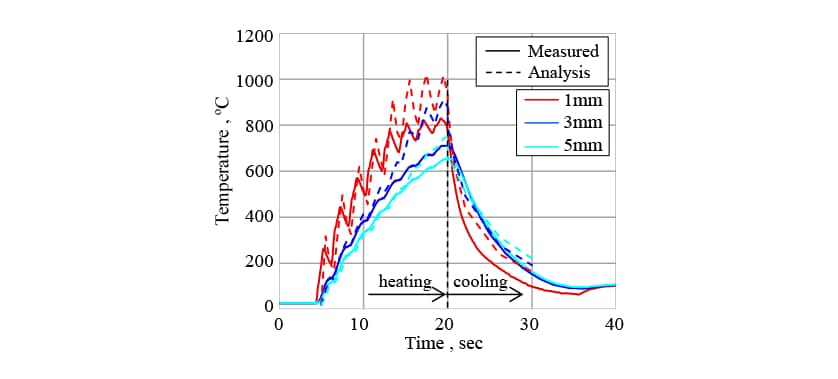
In Fig. 11, the solid line indicates the measured temperature history and the dashed line indicates the temperature changes predicted by the analysis. Because the crankshaft is rotated as it is heated, the temperature of the surface and its vicinity increases like a wave form. Also, the change in magnetic properties that occurs after the temperature exceeds the Curie temperature (770°C) makes heating suddenly much more difficult and the heating area moves from the surface to the inside area. While the error in the predicted temperature history becomes somewhat larger in the later part of the heating process, it is broadly able to reproduce the heating phenomena, including those characteristics described above.
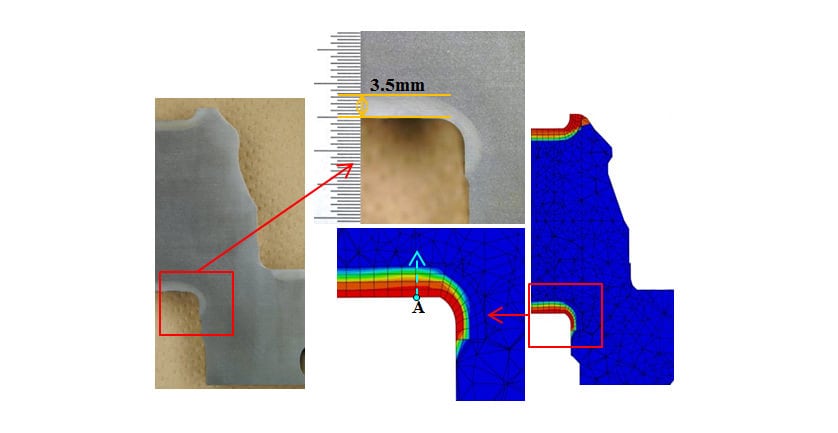
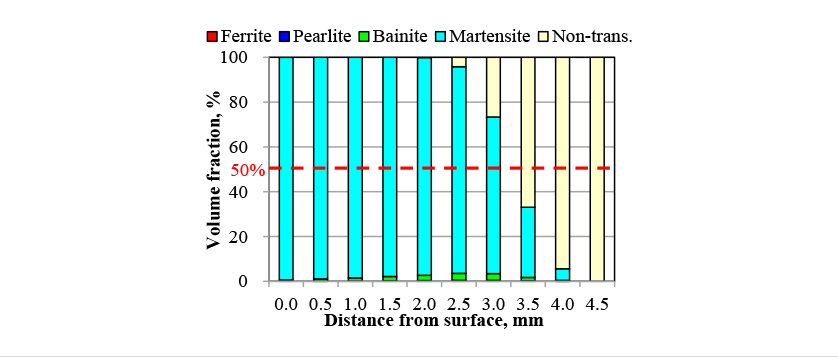
Fig. 12 shows a metallographic structure photograph of the crankshaft cross-section after hardening and the distribution of martensite volume fraction predicted by the analysis. The hardening pattern is accurately predicted, including that the hardening depth is deeper in straight part than curved part for the crank pin. Fig. 13 shows the phase fraction predictions from point A in the direction indicated by the arrow in Fig. 12. Here, “Non-trans.” indicates phase fractions that did not transform to austenite during induction heating. Whereas the surface region is entirely martensite, the amount of diffusional transformation phases formed increases along the quenching depth. Because of the fast cooling rate used in the test, diffusional transformation mainly formed bainite phase, with very little ferrite or pearlite phases. As the predictions for the limit hardening depth at which the martensite phase fraction is 50% ranged between 3.0 mm and 3.5 mm, the value can be assumed to be around 3.25 mm. This is close to the measured hardening depth of 3.5 mm, indicating that the phase transformations during hardening have been reproduced accurately.
These results show that the phase transformations during heating and cooling are accurately predicted and the validity of this method introducing the development equations that considers autocatalytic nucleation.
4. Conclusions
This work succeeded in predicting the phase fractions for ferrite, pearlite, bainite, and martensite. By introducing a development equation that considers autocatalytic nucleation during bainite transformation, and by using an autocatalytic nucleation coefficient determined from the CCT diagram phase fractions, it accurately predicted the amount of each phase formed during hardening. The phase fractions were verified by performing induction hardening tests on a crankshaft made of non-thermal refining S50C steel, which is widely used in heat treatment. The validity of this method was confirmed, with the measured hardening depth of 3.5 mm comparing to a limit hardening depth of about 3.25 mm, indicating good agreement.
In the future, Yanmar intends to predict residual stress in induction hardened materials by using this method in a coupled analysis of induction heating, phase transformations, and the strain that occurs during transformation.
5. References
- (1)Tatsuo Inoue, Yoshihiro Morimoto, “Metallo-Thermo-Mechanical Simulation of Jominy Test Procedure Introducing Developed Material Database "MATEQ"”, Journal of the Society of Materials Science, Vol. 52, pp.1192-1197, (2003) in Japanese.
- (2)Wang Zhi-Gang, Tatsuo Inoue, “Analyses of Temperature, Structure and Stress during Quenching of Steel with Consideration for Dependence of Transformation Kinetics”, Journal of the Society of Materials Science, pp.991-996, (1982) in Japanese.
- (3)Smoljan, B., Iljkić, D. and Novak, H. “Computer simulation of quenched and tempered steel properties”, JAMME, Vol.46, pp.175-181, (2011).
- (4)Masakazu Takagaki, Yutaka Toi, ”Analysis of Induction Hardening by 3-dimensional FEM Considering Coupling of Induction Heating, Thermal Elasto-Viscoplasticity Damage and Phase Transformation”, Transactions of the Japan Society of Mechanical Engineers, A, Vol.71, No.702 (2005), pp.233-240 in Japanese.
- (5)Fumiaki Ikuta, Takashi Horino, Tatsuo Inoue, “Computer Simulation of Residual Stresses/Distortion and Structural Change in Course of Scanning Induction Hardening”, Journal of the Society of Materials Science, Vol.47, pp.892-898, (1997) in Japanese.
- (6)Bhadeshia, H. K. D. H., “BAINITE : OVERALL TRANSFORMATION KINETICS”, Journal de Physique ,Vol. 43, pp.443 to 448(1982).
- (7)Opdenacker, P., “The Rate of the Bainite Transformation”, Ph.D. Thesis, (University of Cambridge, Cambridge, UK, 2001).
- (8)Kirkaldy, J.S., Thomson, B.A., Baganies, E.A., “Hardenability Concept with Application to Steel”, Edited by D.V.Doane, J.S.Kirkaldy, Warrendale, PA, AIME, 1978, p.82-125
- (9)Koistinen, D. P. and Marburger, R. E., “A general equation prescribing the extent of the austenite-martensite transformation in pure iron-carbon alloys and plain carbon steels”, Acta Metallurgica , Vol.7, pp.59-60, (1959)
- (10)Tatsuro Kunitake, “Prediction of Ac1, Ac3 and Ms Temperature of Steel by Empirical Formulas, The Japan Society of Heat Treatment”, Heat Treatment, Vol. 40(4),pp.181-187, (2001) in Japanese.
- (11)Scheil., E., Anlaufzeit der austenitumwandlung, Arch. Eisenhuettenwes., Vol.12, pp.565–567, (1935)
- (12)Masato Enomoto, “Phase Transformation of Metal”, Uchida Rokakuho Publishing
- (13)Yoshiyuki Miwa, Hidetaka Ono, “About TTA diagram of carbon steel (isothermal Austenization diagram)”, Journal of Japan Institute of Metals and Materials, Vol.41, pp.851-855, (1977) in Japanese.
-IMPORTANT-
The original technical report is written in Japanese.
This document was translated by R&D Management Division.
Author
