 Agriculture
 Recreational Marine
 Recreational Boat
 Premium Cruiser
 Marine Equipment
 Marine Commercial
 Propulsion Engines (High Speed)
 Propulsion Engines (Medium Speed)
 Auxiliary Engines
 SCR System
 Dual Fuel Engine
 Two-stage Turbocharging System
 Electric Propulsion System
 Energy Systems
 Compact Equipment
 Industrial Engine
 Power Generation
 Compact Power Products
Research & Development Center
YANMAR Technical Review
Application of Phenomenological Models for Diesel Combustion under Various Operating Conditions
Abstract
Internal combustion engines have been utilized in the global market as a power source for various industrial applications. Combustion performance, including thermal efficiency and exhaust emissions, are strongly influenced by the ambient conditions and fuel properties. It is known that there are large variations in the density, viscosity, ignitability, and heating value of commercially available fuels. In this study, predictive models of the in-cylinder combustion process were evaluated for a marine diesel engine. The models were calibrated with actual measurement results, and a study of the influence of various fuel properties on engine performance was conducted. The verification results indicated that the models had the potential to be used for combustion performance estimation.
1. Introduction
Yanmar has supplied power train systems to customers around the world based on a motto "Best energy with the minimum impact on the environment". The power source used in a power train system is required to maintain stable power characteristics over a wide range of conditions. Although internal combustion engines are widely used, having excellent characteristics for use as a power source in industrial applications, it is also known that their performance varies depending on the operating environment, including atmospheric conditions (ambient temperature and pressure) and fuel properties. Meanwhile, exhaust emission regulations are becoming progressively more stringent in the face of worsening global environmental problems. In Europe, the emission regulations for passenger vehicles were strengthened in 2017 to include the Real Driving Emissions (RDE) test of emission performance under actual on-road conditions as well as testing using a chassis dynamo. It is anticipated that industrial engines will also be subject to a greater focus on fuel consumption and emissions in the future, creating a need to ensure stable engine performance over a wider range of conditions.
Typical practice in engine development is to perform initial conformity and performance testing under standard atmospheric conditions (25 °C, 1 atm) and using fuel with standardized properties, and then to perform quality checks and adjustments by testing the engines under the conditions they will likely encounter in practice. Unfortunately, with engines now being marketed around the world, it is becoming impractical for engine testing to cover all operating conditions. This has created a need to develop simple and accurate performance prediction techniques and establish methods for pre-emptive quality testing under a wide range of operating conditions. To achieve this, the author has been working on the application of model-based development (MBD) to engine performance prediction. This article describes a study into the potential for using a fuel injection and combustion model for combustion performance prediction.
2. Model Development
2.1. Overview of Engine Model
This study involved the development of a combustion performance prediction model using the GT-Suite analysis tools from Gamma Technologies of the USA. The GT-Suite software can be used for a combined analysis of both fluid flow and mechanical systems. In this context, fluid flow means the intake and exhaust paths and the flow of fuel through the fuel injection system (pump, high-pressure pipe, and injectors), while the mechanical systems include the crank and pistons. The flow analysis uses a set of equations for the conservation of mass, momentum, and energy based on the Navie-Stokes equations, and a feature of the analysis is that, unlike the 3D computational flow dynamics (CFD) code used for detailed analysis, it is able to obtain a solution rapidly by only performing spatial discretization in the direction of flow(1).
The combustion prediction model is made up of separate models for the fuel injection system and for combustion in the cylinder. First, the fuel injection model is used to calculate the fuel injection rate for the given pump operating conditions. Next, the calculated fuel injection rate together with other parameters such as the boost and exhaust pressure are provided as inputs to the cylinder combustion model to predict the combustion process. Note that system identification needs to be performed beforehand for both the fuel injection system and combustion models using actual data obtained under the standard operating conditions.
2.2. Fuel Injection System Model
The fuel injection system, which is for a medium-speed marine engine, with independent pump, high-pressure pipe, and injector for each cylinder is used for the model (see Fig. 1). The fuel injection system model represents all of the functional components, from the fuel pipe at the pump inlet to the injector, as simplified pipe elements and mechanical elements. The following sections describe model development for the plunger and barrel, delivery valve (constant pressure valve), high-pressure fuel pipe, and fuel injector respectively.

(1) Plunger and barrel
Fig. 2 shows diagrams of the plunger and barrel physical layout and model. The fuel that enters the pump via the fuel inlet pipe is temporarily charged in a space called the fuel gallery. Connected to the barrel via a communicating path and feed holes, the fuel gallery serves both as a buffer for supplying fuel to the barrel during the intake stroke and as the receiver for fuel spilled at the end of the discharge stroke. In the modelling, the fuel gallery is finely divided into elements around the circumference, with each element being treated separately as a general branch pipe with specified volume and inlet and outlet shapes. The communicating path includes a narrowed section that controls the fuel backflow from the barrel. This is expressed in the model as an orifice in the pipe, with flow rate coefficients adjusted to match the actual situation.

The plunger that discharges the fuel is pushed up by a roller tappet driven by a fuel cam located under the pump. This pressurizes the fuel in the barrel. The actual pump has a diagonal cut (called a "lead") on the side of the plunger. Fuel discharge starts when the feed hole is closed by the top of the plunger and ends when the feed hole crosses to the lower surface of the lead, thereby creating a flow path between the fuel gallery and the fuel path under the lead. This mechanism means that the fuel injection amount can be adjusted by rotating the plunger to vary the effective length of the plunger discharge stroke. This operation was expressed in the model by setting the effective flow path area of the feed port for the plunger lift separately for the discharge start and end steps. Furthermore, the effective plunger discharge stroke was expressed by adjusting the distance between the discharge start and end steps so as to match the actual fuel injection amount.
(2) Delivery valve (constant pressure valve)
The fuel pressurized in the barrel passes through the delivery valve to the high-pressure pipe. The role of the delivery valve is to maintain an adequate pressure in the fuel path after fuel injection (residual pressure). In modeling, the mechanical components of the delivery valve (the delivery valve itself, valve springs, and ball valve) as shown in Fig. 3 are expressed by mechanical element models of their respective functions. The delivery and ball valve lifts are calculated based on the pressure at their respective upper and lower surfaces and the valve spring force. The effective pressured area of the valve seat is adjusted precisely to ensure accurate calibration of the lift characteristics of the delivery valve.

(3) High-pressure fuel pipe
The lengths and diameters used in the pipe model for the high-pressure fuel pipe are taken from the design drawings.
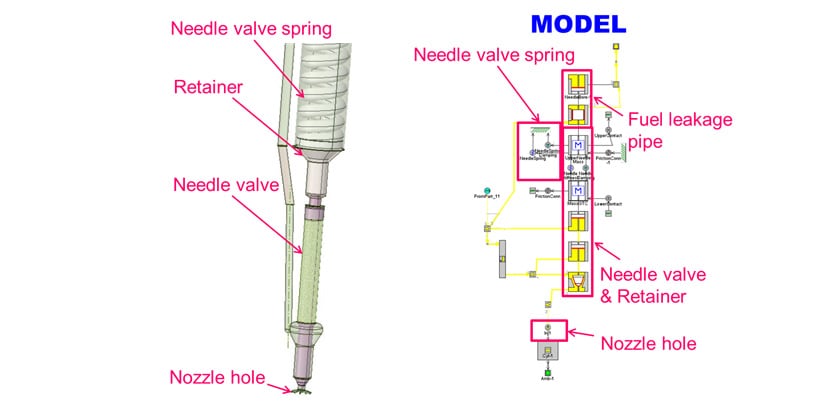
(4) Fuel injector
Fig. 4 shows the model of the fuel injector. Fuel injection is controlled by a needle valve located upstream of the injector nozzle hole. The operation of the needle valve is determined by the balance between the spring force applied to the upper part of the valve and the force applied to the lower part of the valve due to the fuel pressure. In modeling, the masses of needle valve, retainer, and valve spring as well as the spring constant and preset force are determined based on the design values, and the pressured area on the lower part of the needle valve is varied so as to match the valve lift. The needle valve is divided into two mass elements and they are connected with mechanical elements such as spring and damper considering the effect of stiffness of the needle valve. On an actual injector, a small amount of fuel leaks through the clearance between the needle valve and nozzle body. In modeling, a leakage element is inserted between the high-pressure fuel path and fuel outlet path and the clearance is adjusted so as to match the actual leakage.
2.3. Development of Combustion Prediction Model
(1) Combustion model (DIPulse)
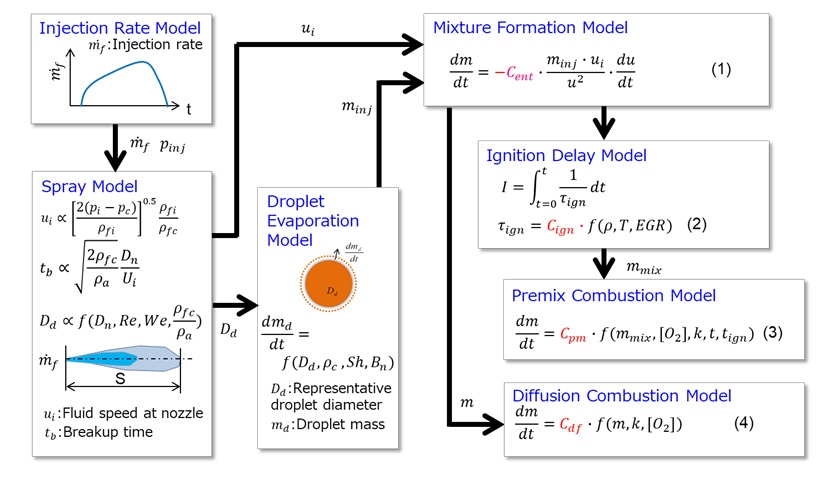
Fig. 5 shows a schematic diagram of the DIPulse simple combustion prediction model. The DIPulse model predicts the formation of the fuel-air mixture from the characteristics distribution along the spray centerline from the nozzle to the spray end, without considering the radial-direction spray distribution for the fuel spray injected into the cylinder. The space inside the combustion chamber is split into three regions (an air region, air and evaporated fuel mixture region, and burnt gas region), each of which is treated as having uniform temperature and chemical composition. During the mixture formation process prior to ignition, the atomization and vaporization process are calculated based on the fuel spray speed and ambient air temperature and density, and the air entrainment is calculated based on momentum theory. The ignition delay is obtained by taking the Livengood-Wu integral using an Arrhenius reaction model, and the combustion rate of the mixture that is formed prior to ignition is obtained using a flame propagation model. As the reaction rate during the diffusion combustion that follows premix combustion is depend on the spray mixing process, the reaction amount is obtained using a turbulent mixing model. Equations (1) to (4) in Fig. 5 are used by DIPulse that express the models of mixture formation, ignition, premix combustion, and diffusion combustion respectively. Various coefficients are adjusted so that the heat generation profile or cylinder pressure history matches the experimental results in order to identify the combustion model.
(2) NOX prediction model
The amount of NOX produced is calculated using the extended Zeldovich mechanism applied to the burnt gas temperatures obtained by a two-region model. The reaction rate constants (κ) for elementary reactions (5) to (7) are adjusted precisely according to actual measurement results to identify the model.

3. Verification of Injection Model
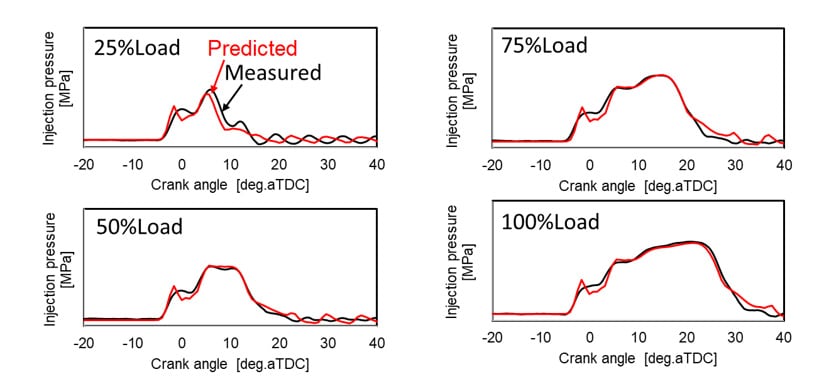
Fig. 6 compares the injection pressure measurements and model predictions at different loads in marine auxiliary engine mode (D2 mode). The results indicate that the predictions are accurate in terms of both the injection pressure and the pressure drop that occurs when the needle valve opens.
4. Study of Influence of Fuel Properties
The main fuel oils used for marine engine are marine gas oil (MGO), marine diesel oil (MDO), and intermediate fuel oil (IFO). However, even MGO and MDO, which are comparatively stable in quality, have densities, kinematic viscosities, and ignition characteristics with wide dispersion comparing to the commercial diesel fuel (JIS no. 2 diesel fuel)(2). This means that fuel obtained from different ports, even if it is of the same standard (belongs to the same ISO8217 fuel classification, for example), may still differ in its properties and cause problems such as higher running costs or a degradation of exhaust performance. The effect of the density, which is one of the fuel property, on the combustion performance is investigated by using the combustion model as the case of a marine diesel engine running with MDO.
4.1. Effect of Fuel Density on Injection Rate
Fig. 7 shows the comparison of the injection pressure and injection rate under the same pump operating conditions when the fuel density varies between 800 and 900 kg/m3. An increase in the mass flow rate by higher fuel density gives an increase in the maximum injection rate and decrease in the injection duration of time.

4.2. Effect of Fuel Density on Combustion
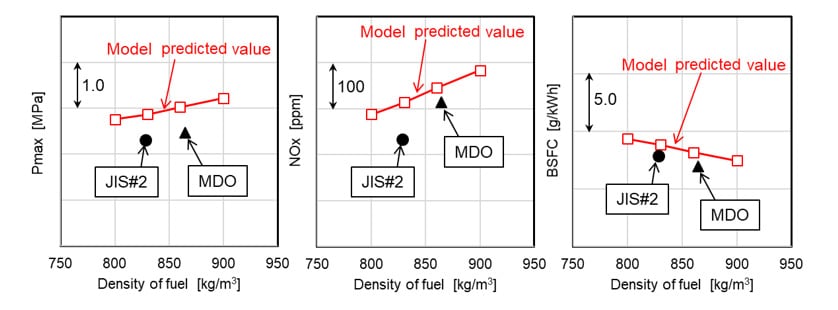
Fig. 8 shows the results of combustion process estimation based on the predicted injection rates described above. This shows that more turbulent mixing occurs with higher fuel density and that heat generation in the main combustion period also increases. Fig. 9 shows the maximum cylinder pressure (Pmax), NOX concentration, and fuel consumption predicted when the fuel density varies, and measurement results with JIS no.2 diesel fuel and heavy fuel oil A obtained from actual engine testing. Due to differences of various properties not only density but also kinematic viscosity, distillation characteristics, lower heating value, and cetane number of the diesel and heavy fuel, it is difficult to conclude directly the effect of density with these results. However, given that they show roughly the same qualitative tendency, the results indicate that the scheme described here can to some extent estimate the effects of fuel properties. In the future, Yanmar intends both to achieve greater clarify the effect of fuel properties on combustion performances in more detail by increasing the accuracies of the models and by implementing a contribution analysis of each fuel property indexes, and also to extend the scope of the model to atmospheric conditions so as to help develop technology for ensuring reliable performance in a wide range of different operating environments.

5. Conclusions
Factors such as the ongoing trend toward electrification in Japan and elsewhere, more stringent emissions regulations, and oil price fluctuations have led to predictions that the internal combustion engine faces a difficult future. What matters, however, is to provide optimal power sources that maximize life cycle value (LCV) for customers while also protecting the global environment. Yanmar, meanwhile, continues routinely to work on technology development in the belief that society can benefit from utilizing the advantages of the internal combustion engine that have been built up over time to achieve higher thermal efficiency and clean emissions under a wider range of operating conditions. Yanmar hopes to bring about “A Sustainable Future” through the many different technological developments it is working on, including those described in this article.
Finally, the author would like to acknowledge the considerable assistance provided during this research by IDAJ Co., Ltd. and Satomi Ihori of the Research & Development Center.
6. References
- (1)Yasuhiro Otaki, “Introduction and Applications of One-Dimensional Engine Simulation Tools”, Journal of the Japan Institute of Marine Engineering, No. 44-3 (2009)
- (2)“Effect of Stringent IMO SOX Regulations on Marine Fuel (1)”, JPEC Report, No. 17 (2015)
-IMPORTANT-
The original technical report is written in Japanese.
This document was translated by Research & Development Management Division.
Author
